How Seasonal Site Spikes Break Your AdSense Forecasts
Forecasting Flops When Seasonality Isn’t Linear
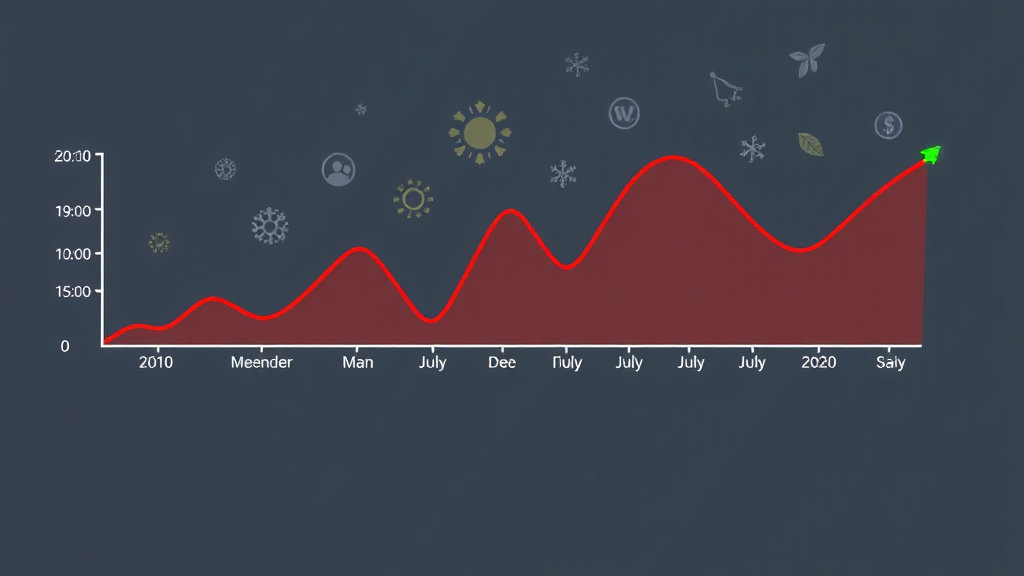
So, quick confession: I once spent the better part of March thinking my gaming deals site was tanking, only to realize April-June traffic always sucks compared to December-January. Turns out, not all seasonality is symmetrical—and if you’re modeling your AdSense earnings with week-over-week deltas, you’re potentially missing a full-cycle drop that doesn’t revert for months.
Google’s Revenue Planner (if you’re lucky enough to have that beta toggle) tries to account for historical seasonality, but it’s still very ad spend-driven. Not niche behavior-driven. So if you’re dependent on why your users click (Christmas shopping vs. spring cleaning vs. random viral TikToks), you’re going to get some ugly forecasts without correction curves.
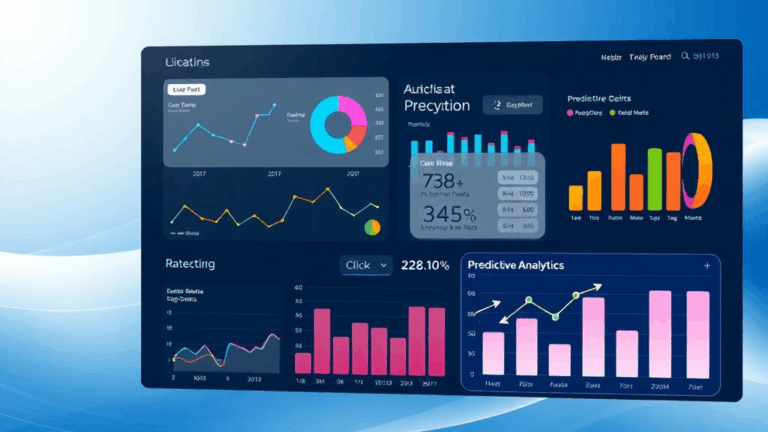
Here’s the hell loop: your CPMs rise in Q4 because ad inventory is hot, sure. But the click-through rate on your pages ALSO changes—especially if you’re in a context-sensitive vertical like coupons or product reviews. Those behavioral shifts don’t map cleanly onto advertiser behavior, which means your predictive graph is a lie. A sexy graph, but a lie.
Google Auto Reporting Doesn’t Understand Your Niche Cycles
There’s this undocumented funhouse effect where the reporting API can lag behind the on-site CTR feedback. I’ve had days where I thought earnings had flatlined, only to get an update 36 hours later that retroactively showed a 30% spike. No rhyme. No push notification.
If you’re pulling data via the AdSense Management API, watch out for the estimatedEarnings vs earnings discrepancy. During high-volume days, the estimation buffer gets more generous. The crazy part? That variance can be worse on pages where you use <ins class="adsbygoogle"> inline vs auto ads. I’m not joking: I saw a $40 day turn into a $55 day two days later.
“Our forecasts are based on past performance and may not reflect real-time activity.”
No kidding, Google. But again—peak CPM days? Don’t trust the morning total. You’ll miss forecasting momentum and make panicky layout changes that kill actual performance.
You Can’t Model Earnings from RPMs Without Getting Burned
Okay, brave soul: if you’ve ever tried projecting daily revenue using backward calc RPMs (like, sessions * RPM / 1000 = revenue), and thought, this tracks, you’re living a lie. RPMs fluctuate RIDICULOUSLY across topical clusters even within the same day. Especially once you’ve got audiences from international locations with varying bid pools. One post about crypto? Sky high RPM. Next post about home crafts? Sinks like a rock.
What actually tripped me out was seeing different RPMs for different segments of the same audience on an email newsletter clickthrough path. Took me weeks to figure out Google’s contextual fill had way more weight on newsletter-referrer traffic compared to organic search.
- Don’t forecast using averaged RPM. It ignores volatility in topic-based demand.
- Use per-page historical RPM where possible. You’ll need a custom data warehouse setup or Data Studio + BigQuery for this.
- Mark days where you had special promos, Reddit virality, or syndication spikes. They pollute your median with outliers.
- If you’re using caching layers with delayed JS injection, note that ad loads might shift after rendering. That changes recorded impressions.
- Auto ads sometimes adjust layout if CLS thresholds are passed. That affects viewability scores, and therefore RPM.
Averaged RPM forecasting is like trying to predict the stock market using last month’s moving average. But if the market was decided by squirrels with AdWords wallets.
Why Ad Units Die Quietly After a Theme Change
You ever tweak your blog’s design at 10PM, think, “looks cleaner,” and go to bed proud? Wake up to $0 in ad revenue? I’ve done that. Twice. Turns out, certain WordPress builders (shoutout to WPBakery in 2021 and Elementor in 2022) will strip out raw JavaScript in modules unless you explicitly mark them as non-sanitized HTML—in their own UI. Worse, it’s theme-dependent.
But even if the code stays, layout shifts kill revenue. One widget that moved from above-the-fold to 700px down the scroll? Gone. Viewability collapsed, and so did bids. Remember: unviewed ad calls still count against fill quota, but advertisers won’t pay for ghosts.
There’s also a weird bug I still see in some Astra-based themes where certain breakpoints render ads offscreen entirely for tablet portrait widths. It doesn’t trigger CLS—but it does crash your CTR on mobile traffic.
Never push a theme change without running heatmaps and live scroll behavior first. Don’t trust simulator previews—you need actual user scroll depth tracking (Hotjar, not just GA4).
Stale Cache = Fake RPMs on High-Traffic Days
One afternoon last summer, our food guide blog went viral on Pinterest. Thirty thousand visitors in three hours, revenue lower than a slow Tuesday. Took me seven, seven hours to figure out our full-page cache was serving a version from early that morning where auto ads hadn’t fully optimized layout.
Google doesn’t rerun the layout engine on every cached page unless the JS loader kicks in as expected. And even when it does, if that page was cached before ad placeholders were finalized, ads might not fire. Especially if you use custom load delays to increase core web vitals.
The hidden trap: async script race conditions
Let me paint it ugly: if your cache layer (Cloudflare APO, WP Rocket, whatever) is serving pre-rendered HTML with uninitialized ad blocks, and those blocks rely on a delayed or conditional load of adsbygoogle.js, your request might fail at runtime. No error. Just… nothing.
TL;DR: flush cache on template or ad layout changes. Period. Don’t think, just nuke.
Why Forecast Graphs Break When Users Bounce Differently
Most naive AdSense revenue predictions assume linear engagement decay. But what blew my mind earlier this year was seeing a giant revenue drop after tweaking article intros. Not traffic—just swaps to how the first five paragraphs were structured. That changed bounce patterns just enough to kill session length, which nuked the 2nd and 3rd ad slot visibility. Nothing in my GA dashboard screamed “danger.” But that second viewport ad? It was my moneymaker.
Once I started segmenting scroll behavior versus ad viewport exposure, it became obvious: shorter intros = less chance people see below-the-fold ads. Lightbulb moment.
An Aha Pattern I Started Tracking:
{
  "avg_session_duration": 93,
  "avg_scroll_depth": 58,
  "first_ad_viewable": true,
  "second_ad_viewable": false,
  "total_earnings": "mid"
}
Add stronger lead-ins, and the scroll depth jumped to 74%. Instantly lifted second ad viewability, and earnings spiked ~20%, even though traffic held steady. The forecast model, of course, didn’t predict any of that because it treated ‘sessions’ as flat yield units. They’re not.
Timezone Weirdness in Daily Totals
On the backend, AdSense slices daily reports by PST. But if you’re comparing your GA4 traffic—which is probably in your local timezone—and you use those sessions to estimate average yield per region… well, surprise. Your traffic and your revenue aren’t actually aligned on the same day.
Combine that with third-party tools like Ezoic or Mediavine, and it gets worse. Your dashboard might claim a $200 day, but broken down into hourlies, 30% of that belongs to 11PM the night before based on UTC offsets. Forecasting based on days instead of 24h moving windows introduces massive modeling errors.
Also: AMP traffic likes to load ads with a staggered timestamp delay. I once had a run where 6AM PST was showing lower earnings for the day, when in fact all the actual clicks had happened between 3AM–4AM—just not counted until the slot fired. You can’t fix this perfectly, but knowing it prevents you from chasing ghosts in your revenue chart.
Predictive Ad Revenue Dies If You Ignore Ad Blockers
Here’s a brutal truth I didn’t want to believe: some of your most loyal users are running uBlock Origin, and your forecast models are lying if they don’t adjust for that. Even if you can’t see them directly through AdSense, you can infer their presence.
How? Compare your GA pageviews to AdSense-impression ratios. If there’s a persistent 15–25% gap on some device categories (desktop Chrome users are the usual suspects), you’re not monetizing them. Yet you’re probably including them in your per-session earning forecasts.
Worse still, forecast drops after a browser update (looking at you, Firefox 105 release) can happen purely due to increased privacy enforcement. I saw a dip in late September that turned out to be related to Firefox silently beginning stricter tracking prevention. Nothing to do with layout or ad demand—just a browser-level kill switch quietly rolling out over three days.
Your model won’t catch that unless you track client-side ad render events manually. Not fun, but necessary if you want to stop forecasting revenue from ghosts.
MDN posted a useful breakdown of these browser-level privacy surfaces if you want to dig deeper without resorting to conspiracy theories.
False Positives from Temporary Link Surges
Last thing (because I still wince thinking about this): one Thursday our site got linked in a high-engagement Facebook thread about regional grocery prices. Traffic spiked. Forecasting tools assumed we were entering a monthlong growth phase. But it was 24 hours. Next day, back to baseline—but our auto-budgeting system kept scaling reserve impressions like we were prepping a Super Bowl surge.
Lesson? Don’t feed social spike days into predictive revenue calculators without annotation. I now keep a running list of anomaly dates (‘big link events’) and patch them out of moving-average calculations manually.
Otherwise your model will be the revenue equivalent of expecting your birthday cake to respawn daily.
