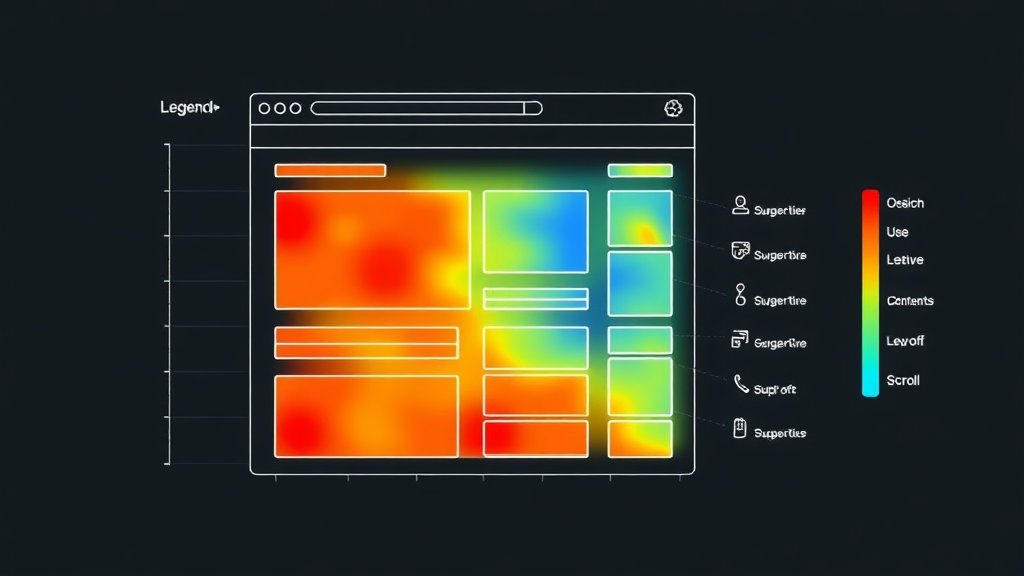
A heatmap should be one of the least controversial tools to set up. Drop a script, wait a few hours, look at the colors. But here’s your surprise of the day: users don’t click like you think they do. They click around the buttons you want them to press. Literally around them.
On one particular WordPress landing page I made for a low-grade SaaS thing, I noticed click clusters gathering in the negative space between two prominent CTAs. Turns out the CTA buttons were part of an animated CSS block moving slightly on hover—just enough to freak people out. Hotjar surfaced it, but only after I cranked sample size above 200 recordings. Before that, the blobs were too random to mean anything useful.
Some heatmap tools map clicks by offset relative to window, not DOM position. If you’re using a floating div or sticky navbar, your map might shift pixels out of alignment when the user scrolls. In early sessions, Lucky Orange showed us hot zones on phantom areas because the floating header wasn’t accounted for. There was no apparent setting for fixed vs scroll-based offsets, just an undocumented behavior glitching in the UI preview vs. actual path trace.
So the rule now? Always open your page in an incognito tab with no extensions. Record your own visit. If your heatmap can’t replicate your real clicks 1:1, throw it out. Or at least switch modes until it stops lying.
Sampling Rate: Why Your Heatmap Looks Like a Hallucination
Most of the free or freemium heatmap tools (Hotjar, Smartlook, Microsoft Clarity, etc) will let you think you’re recording all traffic. You are definitely not.
What you’re doing is sampling. Sometimes it’s 100%, sometimes “random set of X sessions per day.” But they don’t always say when they throttle it. Hotjar used to limit to 2k sessions per month on their old plan unless you explicitly changed the filter. Clarity doesn’t always show mobile interactions properly during high load events—for example, during a flash sale we had, only desktop mouse traces showed up; mobile heat zones just went blank for 6 hours.
The dumbest debugging moment I had was looking for click behavior on a thank you page. But I couldn’t find it in the heatmap tool at all. Turns out the sampling skipped past those low-traffic post-conversion screens. Their logic? “Low pageviews means less useful to analyze.”
It makes some sense. But if your highest-value interactions happen on pages with low views (think: checkout), your heatmap is blind right where it matters.
Scroll Heatmaps Lie When You Add Dynamic Content
You enable scroll mapping, load the page from top to bottom, and then you ask: why is nobody seeing the call to action at the end? So you move it up. But wait—it was visible, and users scrolled by it. What gives?
Heatmap scroll thresholds get measured at initial DOM paint, not at dynamic DOM mutation. If your JS appends content after load (say, you lazy load recommendations or use an infinite CMS feed), the height of the page grows. But your heatmap doesn’t care. It already “measured” scrolled depth as 1000px or whatever. Now your real CTA at 2200px gets marked as unreachable, even if users scrolled to it.
I re-learned this the painful way with Crazy Egg on a Gatsby build. It showed only 20% scroll to the bottom, even though analytics showed strong conversion through the footer button. Turns out the heatmap measured before React was done rendering the final banner.
Quick fix: Insert a tracking pixel after dynamic sections render. Or use tools with DOM-aware scroll recalibration (this is where Clarity is slightly better—even though it has its own weirdness).
You Need to Segment By Device or You’re Wasting Your Time
This feels obvious, but I’ve seen more teams skip this than you’d believe. Here’s why it matters: your mobile users are living a different life than desktop ones. I saw rage clicks on a dropdown menu that collapsed because a fixed header pushed the entire layout off by 50 pixels on Android Safari only—not even iOS Safari showed the bug.
Every heatmap tool I’ve tried has device segmentation, but they hide it behind the filter menus. And some are delayed-release filters: the data has to collect for hours before those filters populate. That’s how I almost missed a layout-shattering bug in the navbar hamburger icon—it only opened if users tapped dead center, and that was mostly on smaller Galaxy devices.
Helpful filtering tactics I wish I used earlier:
Isolate by browser family—not just device type. Chrome vs Firefox is often more useful than desktop vs mobile.
Filter by returning visitor—even basic nav familiarity changes click behavior.
Filter for sessions over 45s. Rage clicks and fluke taps drop off fast below 30s durations.
Exclude auto-refresh bots; some CMS setups ping preview pages repeatedly.
On Clarity, disable the scroll heatmap toggle if dynamic elements exist post-load. It’s a checkbox buried in the session inspector.
Once I filtered mobile-only Clarity sessions for our top converting page, I finally saw the problem: the sign-up form keyboard covered the error messages. None of that was visible in any full-page screenshot. Only the rage click cluster over a single form field gave it away.
Session Recordings Are Heatmap Glue, Not Diagnostics
Session recordings get treated like magic debugging glasses—finally, you can see what the user saw. Except half the time, you’re not seeing what actually happened. Because rendering isn’t always real.
Some tools stitch via coordinate capture, not pixel-perfect video (they use elements + timings + mouse data). That means dropdowns may never visually appear in the recording, even if they did for the user. I’ve seen entire React modal flows disappear from Clarity videos, because the component was outside the tracked DOM subtree. You get a recording with a white screen and rogue clicks floating around like ghosts.
In one case, the user bought a product—but the playback looked like nothing happened; no cart open, no click press visually, just a redirect. Five hours of my life I’ll never get back, assuming the tool was bugged. Then I realized the cart modal was appended into body dynamically but rendered outside the trackable frame.
If a session replay looks blank but logs show interactions—assume it’s a DOM boundary or shadow DOM issue.
Also, session recordings won’t catch device-level changes. Autocorrect popups, keyboard overlays, permission dialogs—none of that’s rendered. Watch enough mobile sessions and you’ll realize how many users are guessing their way through your UI.
Heatmap Scripts Can Break Your JS If You’re Not Watching CSP
I only learned this one because I obsessively test staging environments with CSP levels locked down. If you ship your site with a content-security-policy that blocks inline script execution, some heatmapping vendors will silently fail.
Most inject via inline JS, because they’re lazy or because that’s faster for tracking session starts. So you end up with:
Refused to execute inline script because it violates the following Content Security Policy directive: "script-src 'self'"
Some tools just don’t start recording. Others (looking at you, some lesser-known Shopify plugins) inject tracking code that crashes silently, breaking other global JS hooks in the process.
If you’ve ever noticed a heatmap script “breaking” your form submission or hijacking click events: it’s probably because they wrapped addEventListener with their own handler and never released it properly. One time, our signup CTA stopped working entirely—only when the user had mouse movement. Turns out the heatmap tool tried to debounce it to avoid noise. I’ve never deleted a vendor faster.
Behavioral Edge Cases That Don’t Map Cleanly
There’s some stuff heatmaps just can’t show properly, even though they pretend to. Gestures, hover menus, mouseleave-triggered popups—they can track coordinates all day, but they have no semantic grasp of what it means.
One scenario I debugged was a mega-menu hover zone showing 100% click abandonment. The heatmap made it look like everyone hovered, then clicked nothing. Reality? Users moved their cursor to trigger the menu, but the delay + hover logic was janky. The menu kept retracting prematurely because our delay timer started on mouseleave instead of the target button.
No heatmap could tell me that. I only figured it out by switching to live screen sharing with a tester and watching them struggle in real-time.
Another trap: pointer vs touch interactions. On hybrid laptops or touchscreen monitors, you may get input noise recorded as blurred click heat. This skews mobile heatmaps dramatically, especially when users use pinch-to-zoom instead of navigation tap. One recording showed 17 taps across a sign-up button, but the user never converted. They were adjusting zoom level, not interacting with the form.
Using Heatmaps to Debug Rage Clicks
This is one of the very few things that Clarity does better than most tools: rage click detection. It’s simple, but it works. If someone clicked the same pixel three or more times in rapid succession—it flags it. But here’s the not-so-obvious caveat: the algorithm seems to treat tiny mouse movement as separate clusters unless your site is static enough. So animations break rage detection.
If your buttons animate 1–2px between hover and idle, those clusters might not merge. You think it’s a calm user, just moving slowly. In practice, they’re frustrated and fleeing.
I had to disable all CSS hover transforms on touch devices after seeing this in action. It wasn’t just aesthetic—it was breaking signal fidelity.


 Tanked My Page RPM in AdSense")