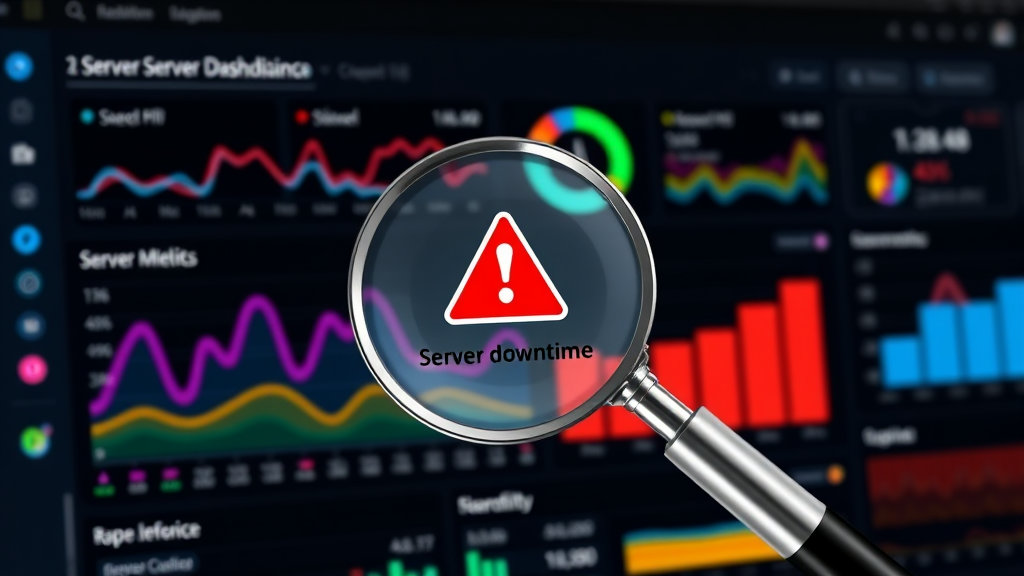
Monitoring Isn’t Monitoring if It Needs You to Notice
The number of times I’ve caught downtime through a panicked reader email before any alert hit my inbox… yeesh. I once saw a “server unreachable” query come in via Contact Form 7, and I thought, “Huh, weird form glitch?” Nope. My blog in Singapore was flat-out dead for two hours. StatusCake didn’t ping. UptimeRobot said ‘200 OK, all good here.’ Hilarious.
What tripped it? Cloudflare was still responding and sending a bad cached version. My server host (DigitalOcean at the time) had rate-limited outgoing pings because of what they thought was bot abuse. Monitoring tools believed the site was alive because response headers looked normal—despite the body returning a mangled maintenance page that didn’t even contain the word ‘maintenance.’
Fixes That Did Not Help:
Adding another Pingdom monitor hitting the same path, same issue.
Custom keyword check (my footer copyright string) — that string was cached too.
Trying to patch together Discord webhook bots — delayed by over 12 minutes.
What finally helped? I set up curl-based cron scripts on a geographically separate server to compare content fingerprint diffs with previous snapshots. If the hash changed or was blank, I fired off SMS. I straight-up wrote my own broken-ass uptime checker before I found Cloudflare’s origin monitoring to be slightly more honest.
Performance Feels Fast Until Google Slaps You in Search Console
I had multiple clients swear their mobile Core Web Vitals were above water until Search Console came down like the hammer of Chrome telemetry truth. Turns out, when you’re sitting on gigabit fiber in desktop Chrome DevTools, you’ll convince yourself that your site is basically teleporting pages. But field data doesn’t lie the way synthetic lab stuff can.
Here’s the weird bit: one lazy-loaded video carousel was delaying FCP only when the browser’s Network Information API showed a ‘4g’ connection — Chrome throttled rendering behind the scenes even though the asset was supposedly async. I only caught it after digging through a Lighthouse JSON export and seeing the trace-consuming ‘idle callback’ scheduling pushed past 3.5s on mobile profiles.
renderBlockingStatus: "defer-but-rendersYNC" // TF does that even mean?
After rage-Googling that API status, turns out it was a Chrome scheduler bug that only popped when the animated SVG assets exceeded 500KB compressed and were initiated from a micro-task inside IntersectionObserver. Found no mention of it on MDN, had to dig through Chromium bug tracker threads circa 2022.
AdSense RPM Numbers Will Gaslight You by Country
I briefly ran a Finnish electronics blog (don’t ask) and at one point got excited because the RPM shot up to what looked like upper double digits. Celebrated, then noticed traffic had dropped 90% from the US and my only visitors were a few emails sent to myself. The RPM calculator still happily declared I was achieving a glorious yield per thousand views — which, sure, if your only visitor is you and you’re running high-CPM test ads, the math checks out.
The issue: RPM calculation in AdSense is session-anchored over inconsistently rounded visits, not pageviews. And once your traffic dips under a particular floor (around one or two per country per day), it starts extrapolating based on rates, not actual fill. After three weeks of stats hallucination, I built a giant country breakdown in Google Data Studio just to cancel that illusion.
Notes from Pain:
Don’t trust RPM shifts unless you cross at least 300 impressions per geo per day.
Obvious, but: fill rate is capped silently if your content category is flakey. Parenting stuff especially.
Pages with heavy local storage interactions randomly lose anchors — that skews bounce math.
OAuth Token Expiry Doesn’t Warn You — Until It’s Weirdly Late
AdSense API’s OAuth tokens expire, we all know, but the reality is we all let it slide since Google refreshes them “automatically.” Except, I had one WordPress dashboard widget that silently died when the token got blackholed by a previously-connected-but-now-premium plugin module that tried to set new auth scopes behind the scenes. AdSense revoked the JSON token and… no warning. No email. Just a loop of 403s that throw a default catch in WP-JSON response.
I finally spotted it only because I noticed the dashboard’s ad revenue field was blank and emitting a JavaScript parsing error on a non-UTF8 character. Yay for copy-pasting token payload into a framed block without encoding.
Things That Token Revocation Broke:
The dashboard widget (obviously)
My Zapier webhook for daily reporting (triggered 400 client errors silently)
Backup syncs that used AdSense timestamps to align posts for template matching
Eventually I re-authorized everything manually, but I threw in a date logging script after that:
// Trigger 7-day reminder pre expiry
if (token.expiry - Date.now()) < 604800000) {
  alert("Token expiring soon")
}
It’s dumb and lives in a scheduled Cloud Function, but at least it speaks up when it dies, unlike half these integrations.
When Metrics Conflict, Your CDN Logs Are the Truth Layer
I’ve seen pageviews differ by 20% between Google Analytics and AdSense. And no, it’s not just ad blocker interference. That’s the easy out. The cause? Deferred JS injection by performance plugins like NitroPack or FastVelocityMinify, which delays the GA fire past window.onload — but your AdSense snippet still runs immediately if it’s inline or in the head.
What gave it away? A discrepancy in unique IPs forwarded by Cloudflare into log tailing. Those logs showed a dead-even rate of requests that should have mapped roughly 1:1 to pageviews. But Analytics undercounted and AdSense overcounted because behavior timing APIs were also suppressed — you basically broke your own GA fidelity to chase Lighthouse scores.
“I optimized myself out of knowing who showed up” — me, choking on delayed DOMContentLoaded soup.
Tips I Wish I’d Known First:
GA4 in debug mode lies to you. Always check raw endpoint hits if you suspect counting bugs.
Use a CDN that lets you tail logs — BunnyCDN and Cloudflare give structured access under edge workers or R2 logs.
Stagger analytics and AdSense via different async paths if you use heavy render-blocking JS.
Client Modals That Hijack the Body Tag Break Scroll Events in Reporting Tools
Let me paint a picture: Client loads a fancy page builder plugin. Adds a modal for newsletter signup. This modal, for no earthly reason, detaches the <body> from the DOM and manages scrolling via a shadow wrapper container. Now, 80% of custom scroll-depth tracking events die because they’re no longer tracking the actual document flow — just relative position within a psuedo-scroll plane.
You shove heatmaps on it, everything’s flatlined below the fold.
Most analytics tools like Hotjar and Microsoft Clarity rely on body scroll height or viewport ratios. Once you interrupt that structure, nothing knows what ‘30% scrolled’ means anymore. You get bizarre sessions where people seem to scroll instantly to the bottom when in reality they’re stuck fighting a modal container with a 3D transform CSS effect.
The only reason I caught it? Session recording showed users stuck behind a phantom white div that only existed in z-index jail. I popped open devtools and realized the entire HTML hierarchy was rebuilt with scoped elements living inside a detached overlay container. It looked like someone ported Electron’s shell into a jQuery modal.
Cloudflare Cache Invalidation Race Conditions
I had a multilingual site that updated post titles dynamically using WPML, and I purged cache on post-update hooks. All good — except sometimes, French users would see the new German headline for a fraction of a second, even after a hard refresh. I couldn’t explain it at first. Turns out, the custom cache key used was $uri + $locale but Cloudflare’s page rules were matching only URI. The minute both rules overlapped, you got ghosted responses mid-propagation.
The bigger bug, though: Cloudflare doesn’t fully propagate Regional Edge invalidations during high-traffic periods if the queue hits a congestion threshold. I had to wait ~2 seconds for Frankfurt edge to stop serving stale content, but Warsaw, for example, still served old markup for 40 seconds. No UI warnings. Just a silent delay while your cache dragnet resets.
I confirmed it with curl headers and watching the response age decrement from 230s to 0s as the cache updated. Shouldn’t have needed packet-sleuthing just to trust a purge, but here we are.
Honestly, the fix was setting cache-everything rules to include more precise path variations and appending ?__cb={timestamp} on forced updates so old versions weren’t accidentally picked up by something down the pipe.
Frontend Field Data Is Useless Unless Session Stitching Is Clean
Don’t assume the data you’re getting from any RUM (real user monitoring) framework maps meaningfully to user intent unless you stitch it against session IDs. I learned this the ugly way trying to diagnose why a new CTA design tanked conversions — turns out, the high form-abandon rate was actually from returning visitors who’d already submitted it once and encountered it again due to a localStorage expiration clearing too aggressively.
The frustrating part? The RUM tools showed them ‘engaging’ — hover events, partial typing — but none of it connected unless you preserved session continuity beyond the default cookie lifespan, which was sometimes overridden by AMP or Facebook in-app browser quirks.
Only when I hooked user fingerprinting against GA4’s session_id property did the attribution map properly, and the form was innocent. Also learned Facebook WebView 80 drops third-party localStorage in iframes fast enough to fry anyone relying on it for identification.
")